- Published on
Prometheus Relabel Config Examples
- Authors

- Name
- Ruan Bekker
- @ruanbekker
This is a quick demonstration on how to use prometheus relabel configs, when you have scenarios for when example, you want to use a part of your hostname and assign it to a prometheus label.
Prometheus Relabling
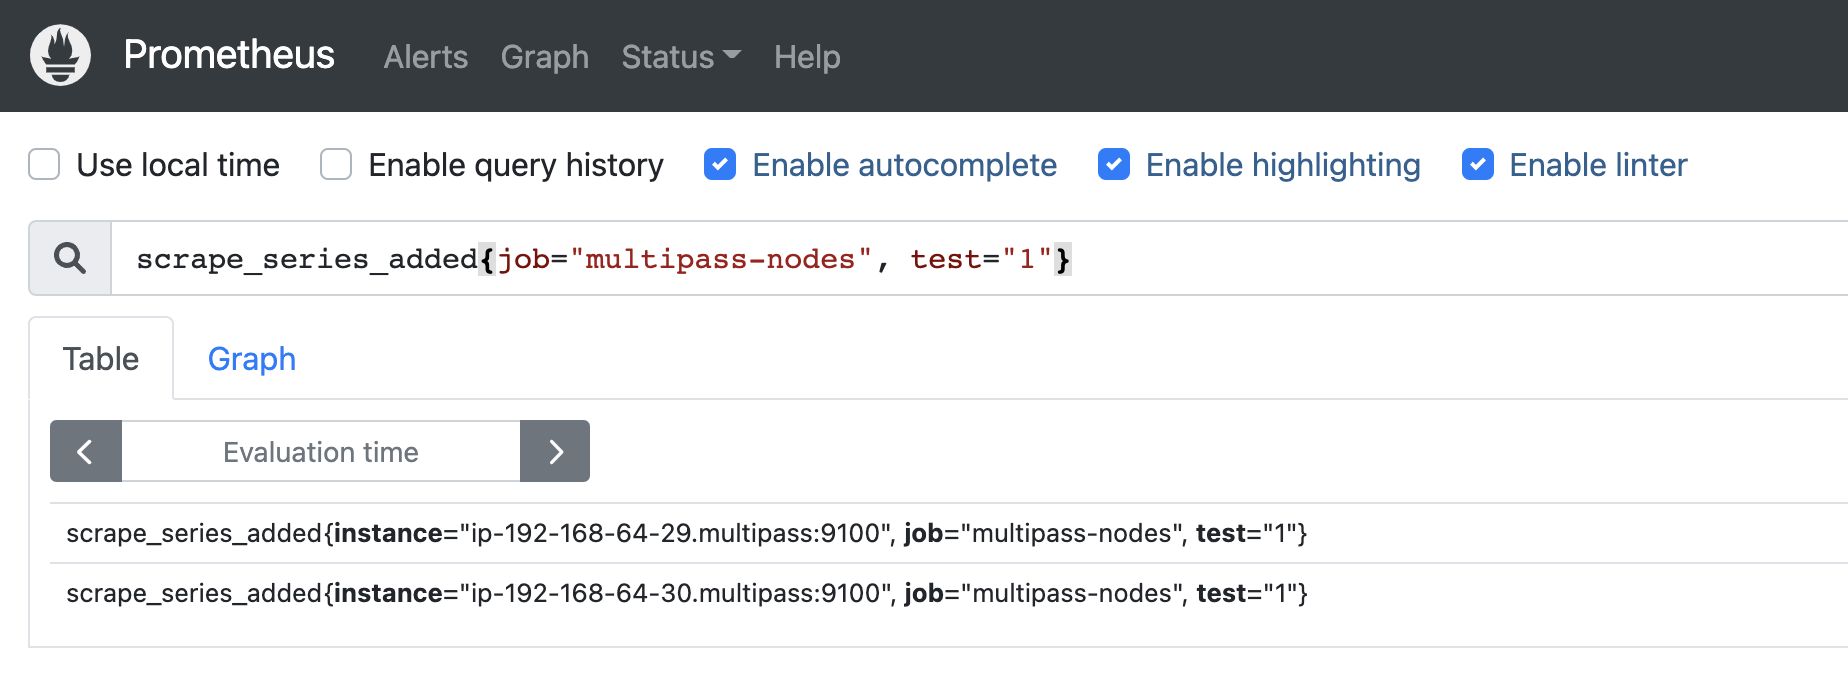
Using a standard prometheus config to scrape two targets:
ip-192-168-64-29.multipass:9100ip-192-168-64-30.multipass:9100
global:
  scrape_interval:     15s
  evaluation_interval: 15s
  external_labels:
    cluster: 'local'

scrape_configs:
  - job_name: 'prometheus'
    scrape_interval: 15s
    static_configs:
    - targets: ['localhost:9090']

  - job_name: 'multipass-nodes'
    static_configs:
    - targets: ['ip-192-168-64-29.multipass:9100']
      labels:
        test: 1
    - targets: ['ip-192-168-64-30.multipass:9100']
      labels:
        test: 1
The Result:
When we want to relabel one of the source the prometheus internal labels, __address__ which will be the given target including the port, then we apply regex: (.*) to catch everything from the source label, and since there is only one group we use the replacement as ${1}-randomtext and use that value to apply it as the value of the given target_label which in this case is for randomlabel, which will be in this case:
global:
  scrape_interval:     15s
  evaluation_interval: 15s
  external_labels:
    cluster: 'local'

scrape_configs:
  - job_name: 'prometheus'
    scrape_interval: 15s
    static_configs:
    - targets: ['localhost:9090']

  - job_name: 'multipass-nodes'
    static_configs:
    - targets: ['ip-192-168-64-29.multipass:9100']
      labels:
        test: 3
    - targets: ['ip-192-168-64-30.multipass:9100']
      labels:
        test: 3
    relabel_configs:
    - source_labels: [__address__]
      regex: '(.+)'
      replacement: '${1}-randomtext'
      target_label: randomlabel
The Result:

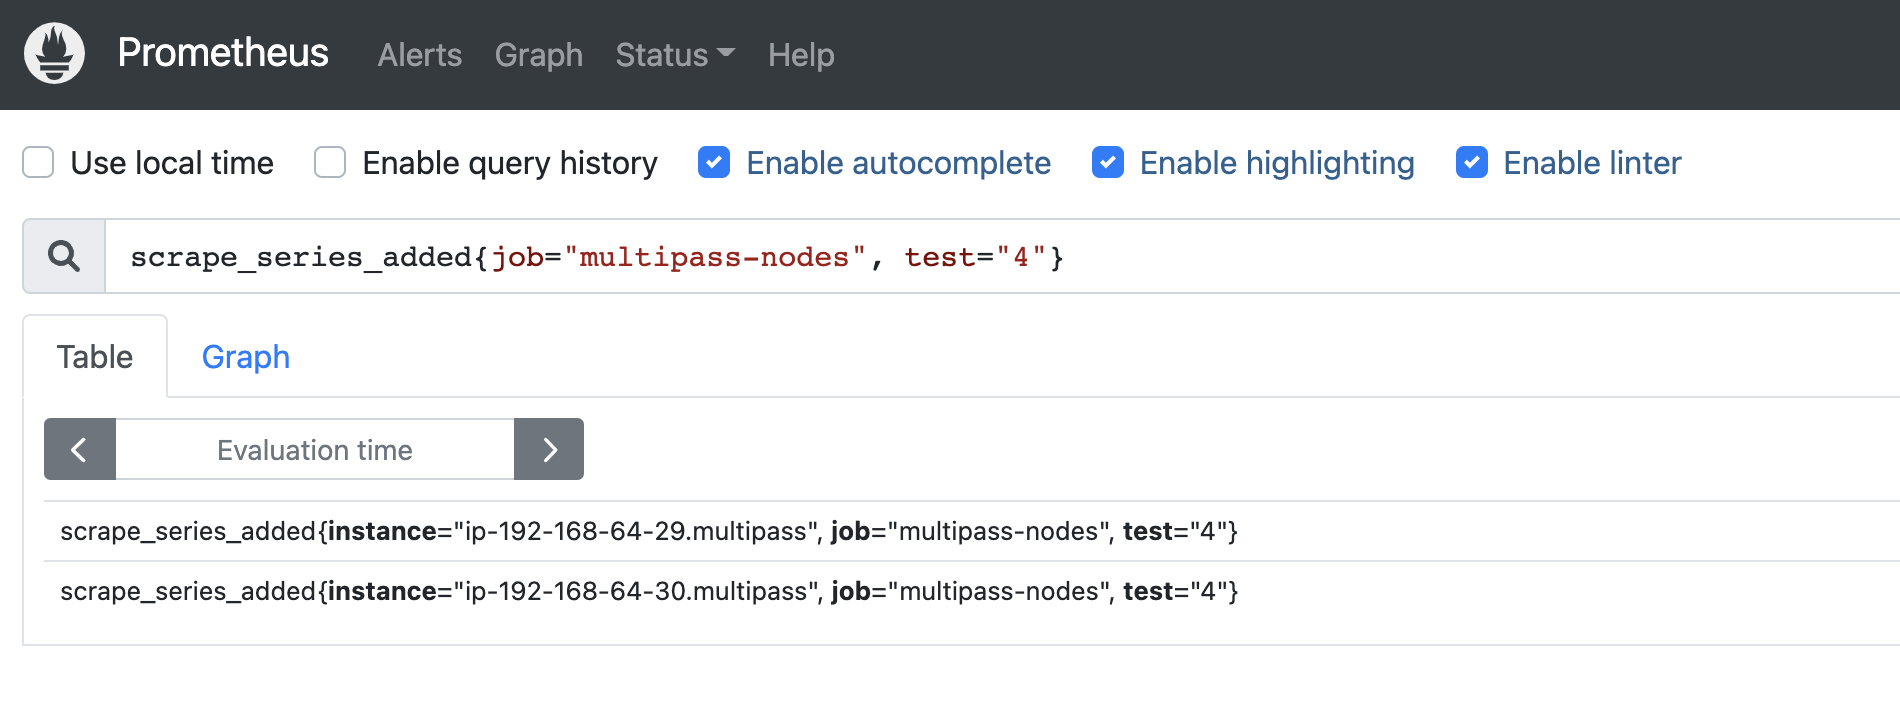
In this case we want to relabel the __address__ and apply the value to the instance label, but we want to exclude the :9100 from the __address__ label:
# Config: https://github.com/prometheus/prometheus/blob/release-2.36/config/testdata/conf.good.yml
global:
  scrape_interval:     15s
  evaluation_interval: 15s
  external_labels:
    cluster: 'local'

scrape_configs:
  - job_name: 'prometheus'
    scrape_interval: 15s
    static_configs:
    - targets: ['localhost:9090']

  - job_name: 'multipass-nodes'
    static_configs:
    - targets: ['ip-192-168-64-29.multipass:9100']
      labels:
        test: 4
    - targets: ['ip-192-168-64-30.multipass:9100']
      labels:
        test: 4
    relabel_configs:
    - source_labels: [__address__]
      separator: ':'
      regex: '(.*):(.*)'
      replacement: '${1}'
      target_label: instance
The Result:
AWS EC2 SD Configs
On AWS EC2 you can make use of the ec2_sd_config where you can make use of EC2 Tags, to set the values of your tags to prometheus label values.
In this scenario, on my EC2 instances I have 3 tags:
- Key: PrometheusScrape, Value: Enabled
- Key: Name, Value: pdn-server-1
- Key: Environment, Value: dev
In our config, we only apply a node-exporter scrape config to instances which are tagged PrometheusScrape=Enabled, then we use the Name tag, and assign it's value to the instance tag, and the similarly we assign the Environment tag value to the environment promtheus label value.
Because this prometheus instance resides in the same VPC, I am using the __meta_ec2_private_ip which is the private ip address of the EC2 instance to assign it to the address where it needs to scrape the node exporter metrics endpoint:
scrape_configs:
  - job_name: node-exporter
    scrape_interval: 15s
    ec2_sd_configs:
    - region: eu-west-1
      port: 9100
      filters:
        - name: tag:PrometheusScrape
          values:
            - Enabled
    relabel_configs:
    - source_labels: [__meta_ec2_private_ip]
      replacement: '${1}:9100'
      target_label: __address__
    - source_labels: [__meta_ec2_tag_Name]
      target_label: instance
    - source_labels: [__meta_ec2_tag_Environment]
      target_label: environment
You will need a EC2 Ready Only instance role (or access keys on the configuration) in order for prometheus to read the EC2 tags on your account.
See their documentation for more info.
Stack
The docker-compose used:
version: '3.8'

services:
  prometheus:
    image: prom/prometheus
    container_name: 'prometheus'
    user: root
    restart: unless-stopped
    volumes:
      - ./prometheus.yml:/etc/prometheus/prometheus.yml
      - prometheus-data:/prometheus
    command:
      - '--config.file=/etc/prometheus/prometheus.yml'
      - '--storage.tsdb.path=/prometheus'
      - '--storage.tsdb.retention=14d'
      - '--web.console.libraries=/etc/prometheus/console_libraries'
      - '--web.console.templates=/etc/prometheus/consoles'
      - '--web.external-url=http://prometheus.127.0.0.1.nip.io'
    ports:
      - 9090:9090
    networks:
      - public
    logging:
      driver: "json-file"
      options:
        max-size: "1m"

networks:
  public:
    name: public

volumes:
  prometheus-data: {}
References
Usful docs:
- https://grafana.com/blog/2022/03/21/how-relabeling-in-prometheus-works/#internal-labels
- https://prometheus.io/docs/prometheus/latest/configuration/configuration/#ec2_sd_config
- https://regexr.com/
Thank You
Thanks for reading, if you like my content, feel free to check out my website, and subscrube to my newsletter or follow me at @ruanbekker on Twitter.
- Linktree: https://go.ruan.dev/links
- Patreon: https://go.ruan.dev/patreon
